Processing VCF files
In this page, we aim to explore the full potential of Pheno-Ranker. Our focus will be on processing a VCF file - a challenging yet intriguing task.
A VCF is essentially a specialized form of a TSV
The Variant Call Format (VCF) is a bioinformatics standard created for the 1000 Genomes Project to store gene variations, evolving to version 4.3 and expanded with formats like gVCF for comprehensive data representation.
The body of the Variant Call Format (VCF), which is essentially a tab-separated values (TSV) file, comprises eight mandatory columns and an unlimited number of optional columns for additional sample information.
Steps
OK, so our goal is to compare samples within the VCF based on their genomic variations. To achieve this, we'll undertake the following steps:
- Transpose the VCF data into a TSV format, arranging it so that each row contains all variations for a specific sample.
- Transform the TSV into a format that is compatible with
Pheno-Ranker, utilizing the provided utility. - Execute
Pheno-Rankerin cohort-mode to generate plots using R. - Run
Pheno-Rankerin patient-mode to identify the most similar sample. - Generate QR codes for the first 10 samples (and decode them back).
What is the source of your VCF test data?
The dataset test_1000G.vcf.gz is a subset extracted from the 1000 Genomes Project, containing approximately 1K variations. For more detailed information, please visit this page.
The idea here is to compare samples (or individuals if you will) by their genomic variations, like if we were comparing a genomic fingerprint. A good example for this would be comparing samples in a multi-sample VCF from a gene panel (or even an Exome) after filtering variations. This method of course could be complemented by adding the phenotypic information on top of the genomic variations, and then use weights. etc.
❗ We advise against using this method for comparing samples with millions of genomic variations.
Let's go!
Step1: Tranpose the VCF to TSV
We are going to be using the included Python script
Can the VCF be multi-allelic?
Yes, the VCF can be multi-allelic. This is how variant information is stored:
"1_15274_A_G,T" : "0|0",
"1_15274_A_G,T" : "0|1",
"1_15274_A_G,T" : "0|2",
"1_15274_A_G,T" : "1|0",
"1_15274_A_G,T" : "1|1",
"1_15274_A_G,T" : "1|2",
"1_15274_A_G,T" : "2|0",
"1_15274_A_G,T" : "2|1",
"1_15274_A_G,T" : "2|2",
In this example, the genotypes are phased, but it works also with unphased genotypes (e.g., 0/1).
utils/csv2pheno_ranker/vcf/vcf2pheno-ranker.py -i test_1000G.vcf.gz -o output.tsv
Regarding paths for executables
Make sure to specify the correct paths for your executables. Here, we show the paths as they exist in the Github repository.
Step 2: Transform the TSV to a compatible format
utils/csv2pheno_ranker/csv2pheno-ranker -i output.tsv -primary-key-name 'Sample ID'
Where the created output.json has the following format:
[
  {
      "1_99490_C_T" : "0|0",
      "1_99671_A_T" : "0|0",
      ...
      "1_99687_C_T" : "0|0",
      "1_99719_C_T" : "0|0",
      "Sample ID" : "HG00096"
  },
  ...
]
Step 3: Execute Pheno-Ranker in cohort-mode
bin/pheno-ranker -r output.json -config output_config.yaml
This created the file matrix.txt. It's a huge matrix of 2504 x 2504 pairwise-comparisons.
The default output is a dense matrix.txt, which is useful for the included R scripts. If you only need a sparse matrix for downstream tools, use Matrix Market output:
bin/pheno-ranker -r output.json -config output_config.yaml --matrix-format mtx -o output.mtx
For graph exports, filter edges explicitly with --graph-max-weight for Hamming distance or --graph-min-weight for Jaccard.
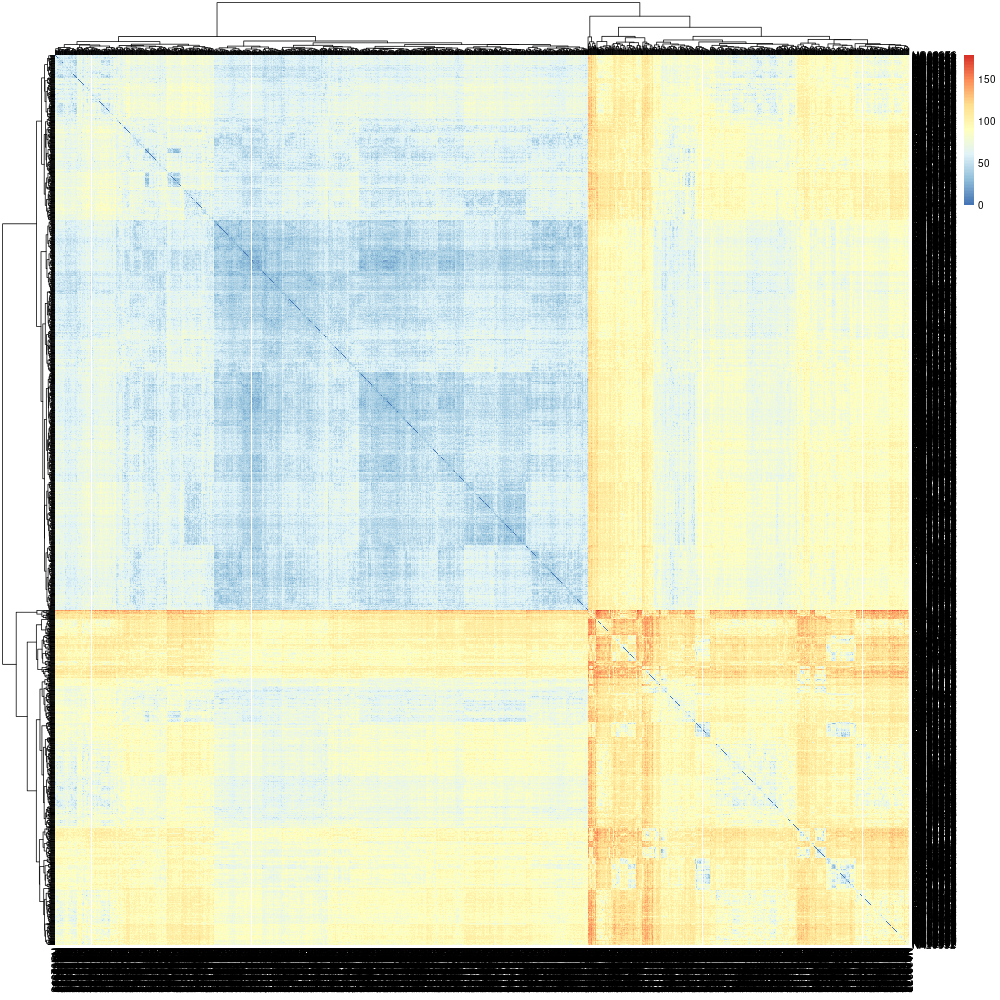
- Heatmap and clustering
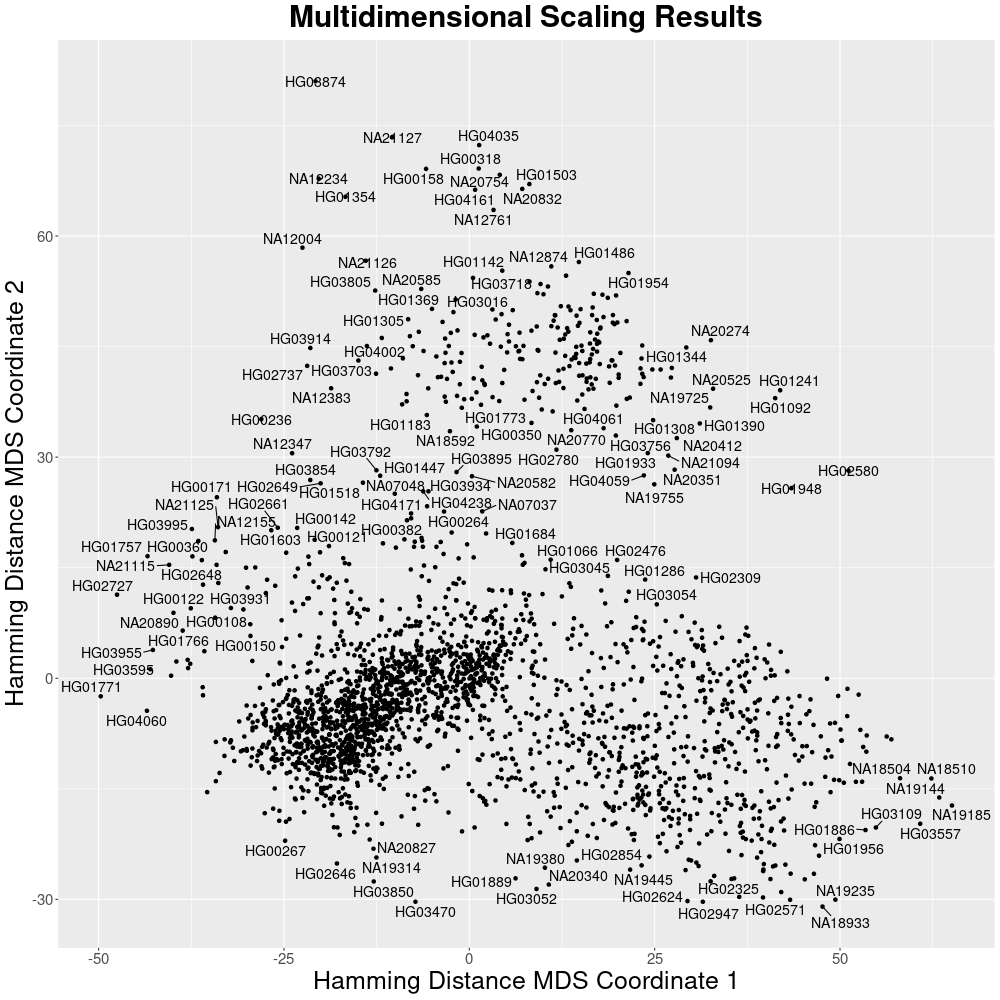
- Dimensionality reduction
Now you can create a heatmap + clustering with the included script:
Rscript share/r/heatmap.R
(Running time < 2 min in Apple M2 Pro)
Or reduce the dimensionality:
Rscript share/r/mds.R
(Running time < 2 min in Apple M2 Pro)
Step 4: Execute Pheno-Ranker in patient-mode
Initially, we will extract a single sample from the cohort, specifically the first one listed in the VCF: HG00096.
bin/pheno-ranker -r output.json -config output_config.yaml --patients-of-interest HG00096
This creates HG00096.json.
Now we run Pheno-Ranker in patient-mode:
bin/pheno-ranker -r output.json -t HG00096.json -config output_config.yaml
See results
| RANK | REFERENCE(ID) | TARGET(ID) | FORMAT | LENGTH | WEIGHTED | HAMMING-DISTANCE | DISTANCE-Z-SCORE | DISTANCE-P-VALUE | DISTANCE-Z-SCORE(RAND) | JACCARD-INDEX | JACCARD-Z-SCORE | JACCARD-P-VALUE | REFERENCE-VARS | TARGET-VARS | INTERSECT | INTERSECT-RATE(%) | COMPLETENESS(%) |
|---|---|---|---|---|---|---|---|---|---|---|---|---|---|---|---|---|---|
| 1 | HG00096 | HG00096 | CSV | 1043 | False | 0 | -3.440 | 0.0002913 | -32.2955 | 1.000 | 3.549 | 0.0053956 | 1043 | 1043 | 1043 | 100.00 | 100.00 |
| 2 | HG01537 | HG00096 | CSV | 1050 | False | 14 | -2.712 | 0.0033449 | -31.5396 | 0.987 | 2.778 | 0.0377136 | 1043 | 1043 | 1036 | 99.33 | 99.33 |
| 3 | HG03598 | HG00096 | CSV | 1054 | False | 22 | -2.296 | 0.0108361 | -31.1101 | 0.979 | 2.342 | 0.0898655 | 1043 | 1043 | 1032 | 98.95 | 98.95 |
| 4 | HG04141 | HG00096 | CSV | 1055 | False | 24 | -2.192 | 0.0141860 | -31.0030 | 0.977 | 2.233 | 0.1087819 | 1043 | 1043 | 1031 | 98.85 | 98.85 |
| 5 | HG04033 | HG00096 | CSV | 1055 | False | 24 | -2.192 | 0.0141860 | -31.0030 | 0.977 | 2.233 | 0.1087819 | 1043 | 1043 | 1031 | 98.85 | 98.85 |
| 6 | HG00237 | HG00096 | CSV | 1056 | False | 26 | -2.088 | 0.0183923 | -30.8960 | 0.975 | 2.125 | 0.1303610 | 1043 | 1043 | 1030 | 98.75 | 98.75 |
| 7 | HG04096 | HG00096 | CSV | 1057 | False | 28 | -1.984 | 0.0236175 | -30.7891 | 0.974 | 2.017 | 0.1546849 | 1043 | 1043 | 1029 | 98.66 | 98.66 |
| 8 | NA12827 | HG00096 | CSV | 1057 | False | 28 | -1.984 | 0.0236175 | -30.7891 | 0.974 | 2.017 | 0.1546849 | 1043 | 1043 | 1029 | 98.66 | 98.66 |
| 9 | NA20534 | HG00096 | CSV | 1057 | False | 28 | -1.984 | 0.0236175 | -30.7891 | 0.974 | 2.017 | 0.1546849 | 1043 | 1043 | 1029 | 98.66 | 98.66 |
| 10 | HG00234 | HG00096 | CSV | 1057 | False | 28 | -1.984 | 0.0236175 | -30.7891 | 0.974 | 2.017 | 0.1546849 | 1043 | 1043 | 1029 | 98.66 | 98.66 |
Sample HG01537 is the closest. It has a distance of 14 to HG00096 and a p-value = 0.0033449.
Step 5: Generate QR codes for the first 10 samples
We are going to compress all variant information (1042 variations) into QR-codes
- First we are going to export the needed files, excluding the primary key 'Sample ID':
bin/pheno-ranker -r output.json -config output_config.yaml -exclude-terms 'Sample ID' --export
- Now we use the included utility
pheno-ranker2barcode:
utils/barcode/pheno-ranker2barcode -i export.ref_binary_hash.json
This has created QR codes (PNG) for each sample inside the directory qr_codes.
See QR codes for the first 10 samples

To decode the QR codes back to Pheno-Ranker format:
utils/barcode/barcode2pheno-ranker -i $(ls -1 qr_codes/*png | head -10) -t export.glob_hash.json
This will create the file decoded.json